Mental Health
depression, anxiety and brain connectivity
Integrating Smartphone Sensing, Surveys and MRI Data: Proof of Concept
Almost 1/3 of college students have clinically relevant levels of affective disorders, such as anxiety or depression. Understanding factors that predispose individuals to these disorders or trigger their onset may allow for improved secondary educational institutional interventions which could beneficially impact upwards of 5 million individuals (18.4 million college students in in the US in the latest census, assuming 30% occurrence of either depression or anxiety).
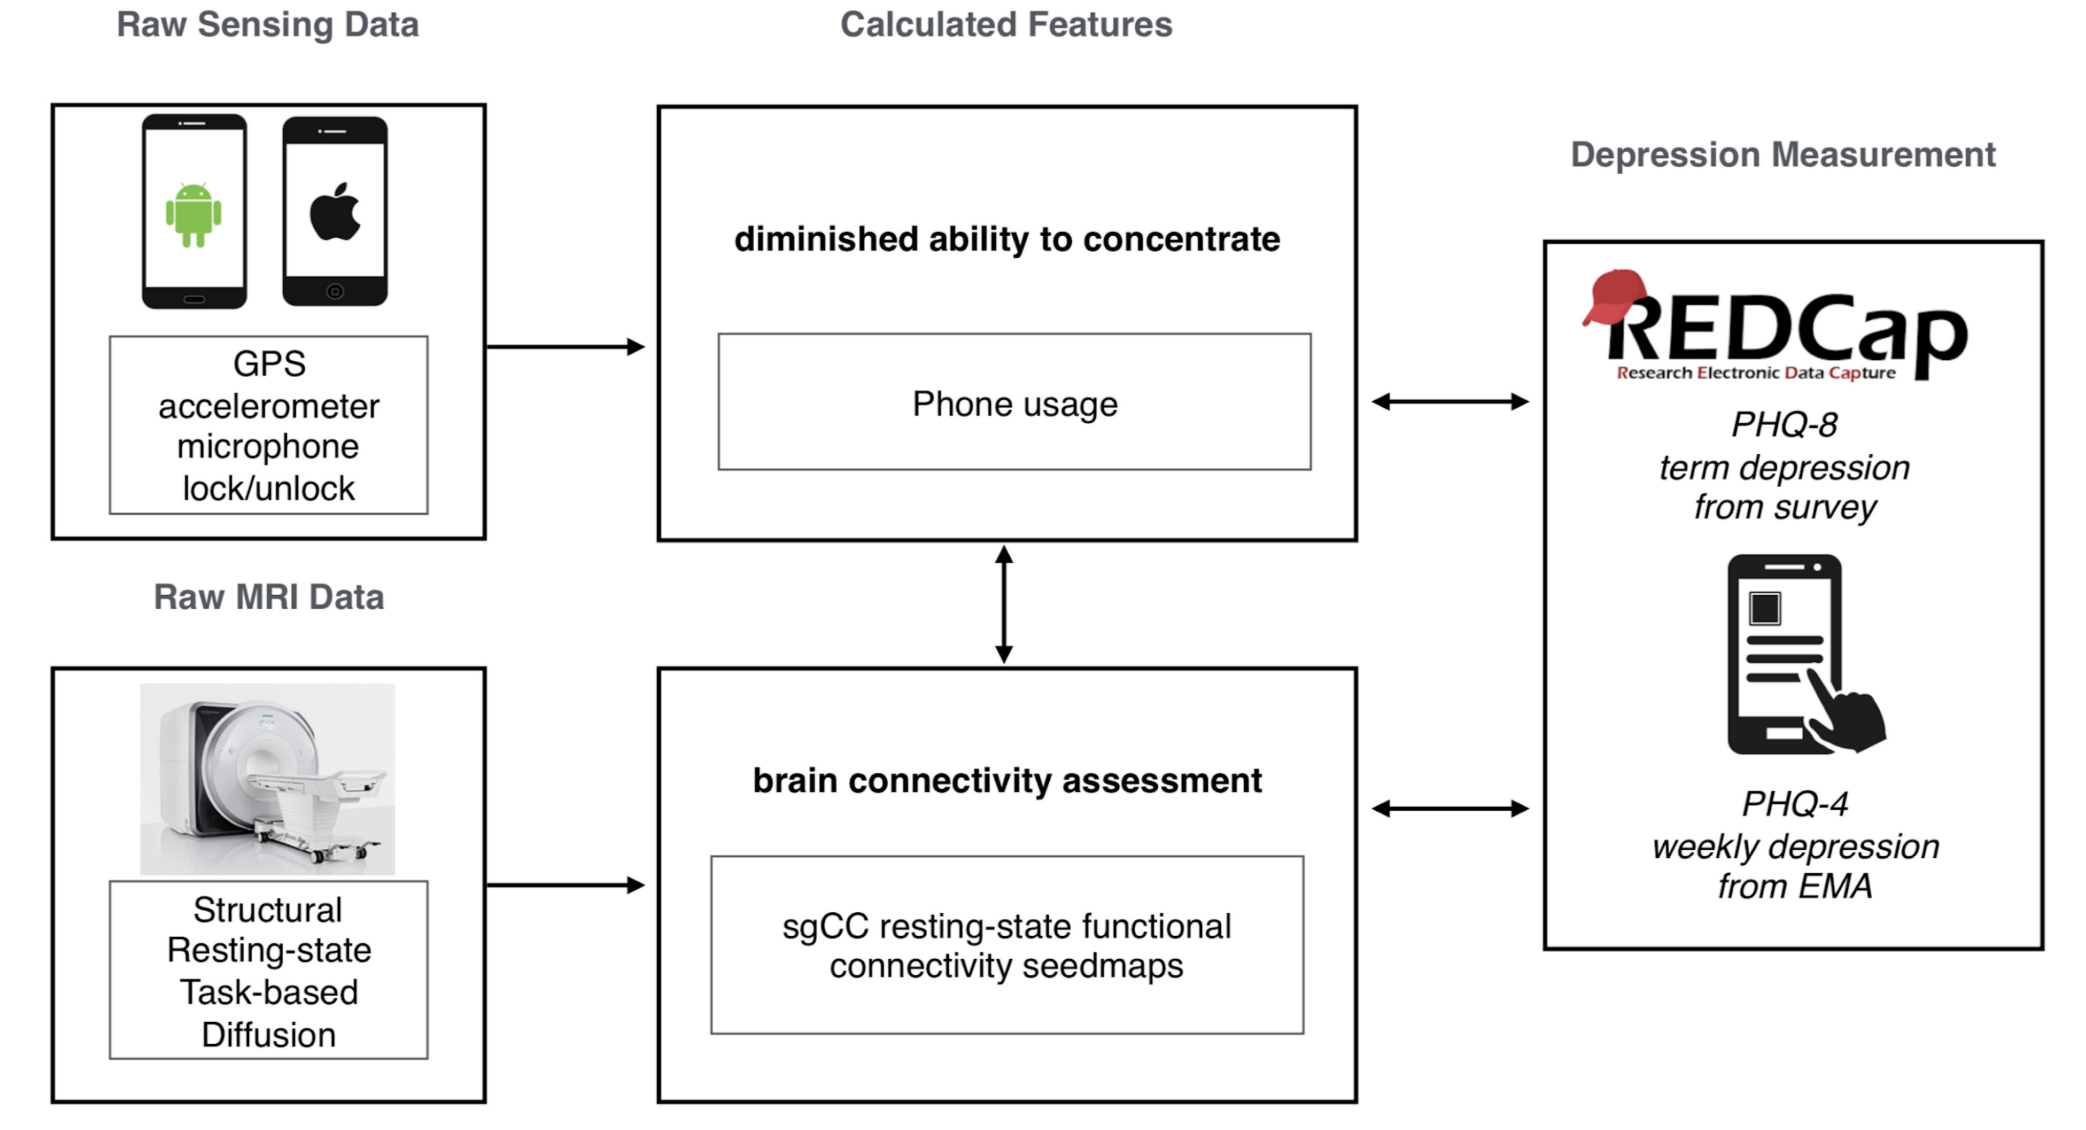
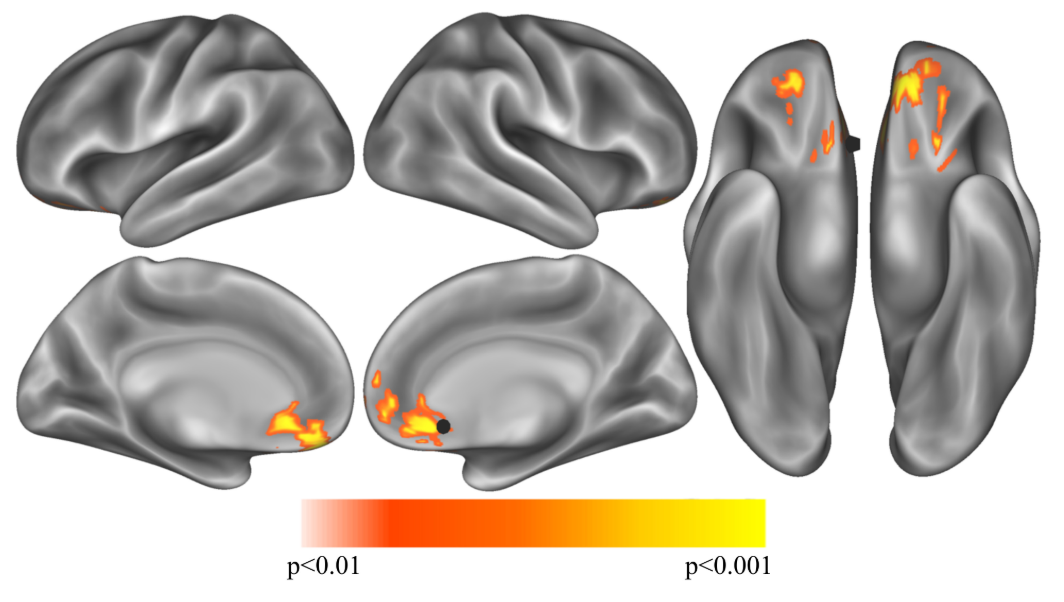
Through StudentLife mobile sensing app we can collect data from individuals’ smartphones in a more ecologically valid manner than available in traditional lab settings. Paired with with real-time surveys, termed EMA’s (Ecological Momentary Assessments), we are able to pair passive smartphone measurements with self-reported surveys. Individuals in these studies participate in functional MRI sessions and return year-after-year throughout their college experience. In a proof-of-concept study to combine these diverse modalities we correlated brain connectivity with phone usage. Connectivity between the subgenual cingulate cortex (sgCC) the duration of phone usage with resting-state functional connectivity from the subgenual cingulate cortex. We observed a negative relationship with sgCC-OFC connectivity and a variety of phone usage and depression metrics.


Across both cohorts, the more individuals used their phone, the less connectivity was observed between sgCC and OFC. Similar patterns were observed for self-reported depressive symptoms and circadian rhythm consistency. These results are correlational and should be interpreted with caution. Our primary motivation for publishing this article was to show that, even with relatively rudimentary analyses, links between self-reported mood score, passive mobile smartphone sensing and functional brain imaging can be observed.
Causal Relationships Between Mental Health Metrics
The above mentioned analyses provide insight into correlations between brain connectivity, phone usage and mood, but do not provide insight into causality. To begin to identify causal, or temporally lagged relationships over time, we applied Peter and Clark Momentary Conditional Independence (PCMCI) to mental health metrics such as depression, anxiety, stress and self-esteem. We were able to identify causal and contemporaneous relationships between these mental health metrics and replicate them across the first year of college of two distinct cohorts.

This study provides a framework for identifying causal factors of anxiety and depression in college students, with the key results replicating in two distinct cohorts sampled weekly over the course of an academic year. Stress is a causal predictor of anxiety, while low self-esteem is a causal predictor of depression and, to a lesser extent, anxiety. These results support the vulnerability model of depression and suggest that ameliorating high rates of stress may reduce subsequent increases in self-reported anxiety.
COVID-19, Mental Health and Behavior
The COVID-19 pandemic has impacted the mental health of millions, if not billions of individuals around the world. During the initial stages of the COVID-19 pandemic we characterized mental health and behavioral changes using the StudentLife app. Unsurprisingly, the students we followed were more sedentary, depressed and anxious during this time period.

We then leveraged multiple mobile sensing and mental health features to infer the proportion of news stories related to coronavirus over time. A wide variety of behaviors, including increased phone usage, decreased physical activity, and fewer locations visited, among others, were associated with coronavirus news stories.
This project brings together collaborators with expertise in psychiatry, computer science, neuroimaging and social psychology.