Automated Image Analysis
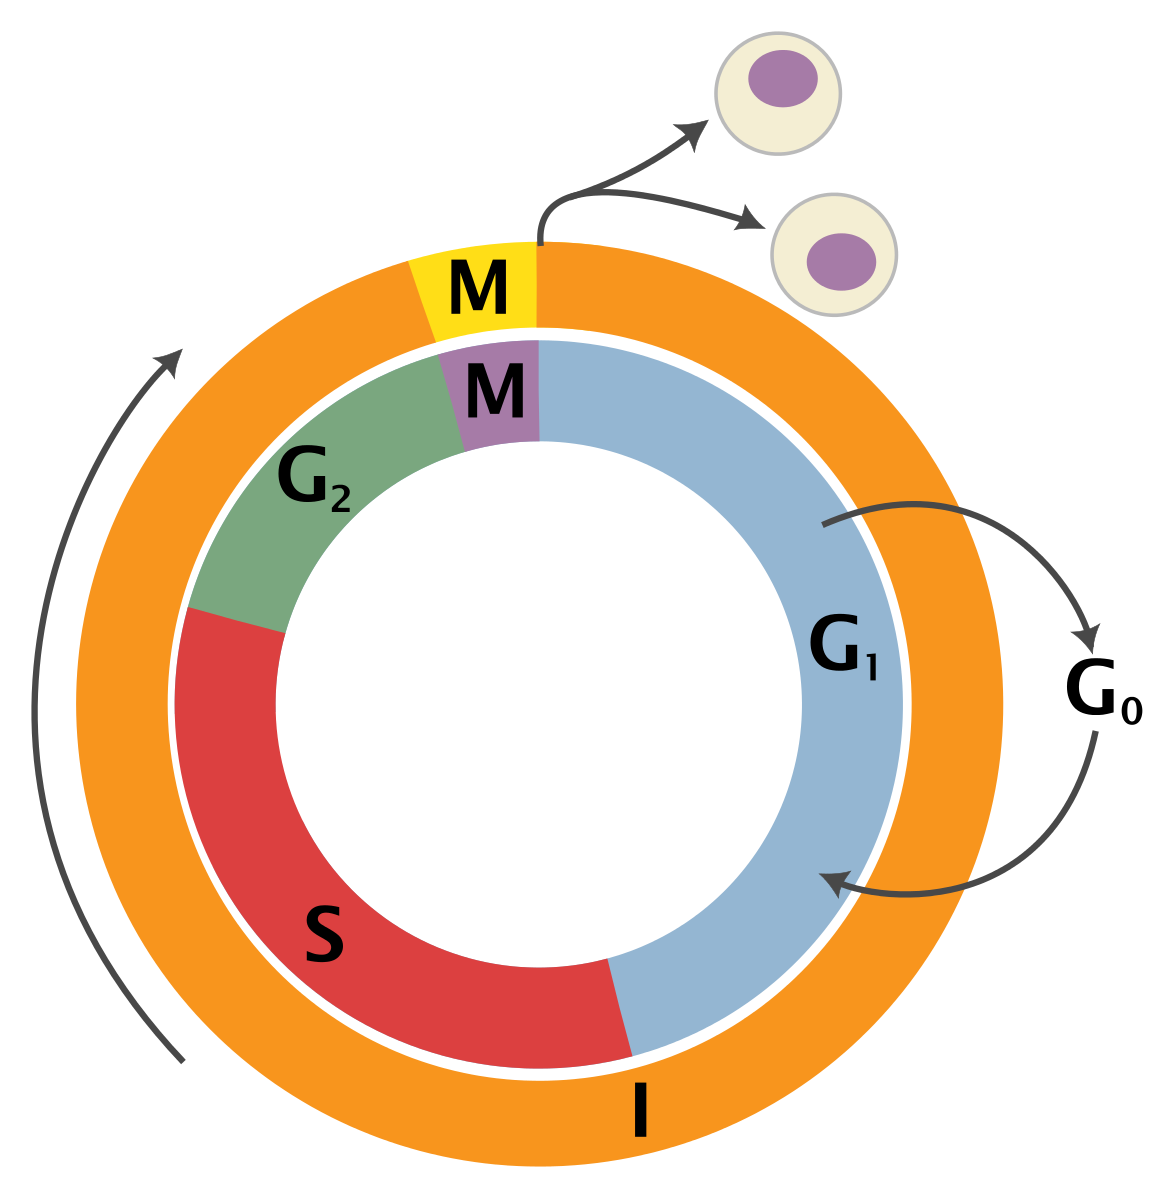
cell phase duration
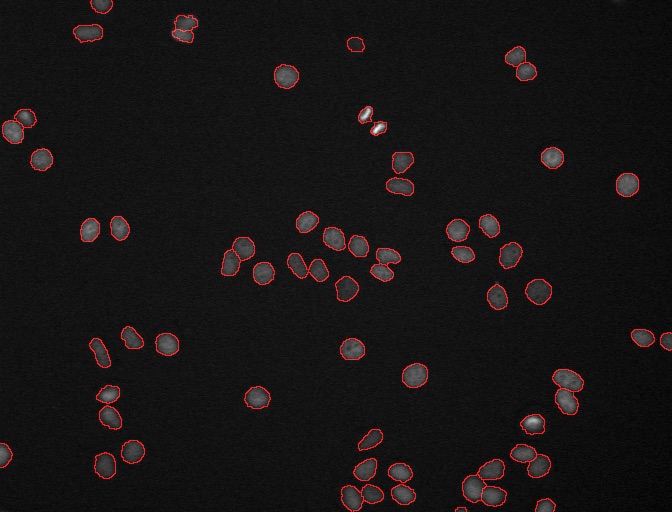
DCellIQ is a user-friendly software package that is designed for quantitative time-lapse nuclei image analysis for cell cycle studies, whose key features include automated nuclei detection, segmentation, quantification, tracking, cell cycle phase identification, and statistical analysis of the cell cycle duration.


Initially, a variety of standard machine learning techniques were implemented, including Support Vector Machines (SVM) and Conditional Random Fields, which were further extended with “Online” SVMs which allowed an experimenter to update the model while manually correcting classifier errors. Full text is available here.
These methods achieved relatively high accuracy, but the goal of the project was to be able to pick up on small perturbations to the cell cycle due from drugs of other manipulations. As cultured cancel cells such as these (HeLa, MC10) spend most of them time in interphase, any errors in the identification of prophase, metaphase or anaphase have big impacts on estimated durations of cell division.
To potentially improve upon the classification accuracy observed with SVMs and using one image of cells, we took a time-series approach. In hindsight, this is where a Bayesian approach would have been very useful. Instead we generated sets of heuristic rules for a few features which change significantly throughout the cell phase, specifically nucleus area and intensity. Full-text of this approach is available here.
By implementing the time-series approach we were able to increase accuracy to an acceptable level for use in drug screening, with no significant differences identified between performance of the algorithm and a human’s rating of the ground truth. This was done using only two human-interpretable features which can facilitate automated analysis of high-throughput time-lapse data sets to identify small molecules or gene products that influence timing of cell division.
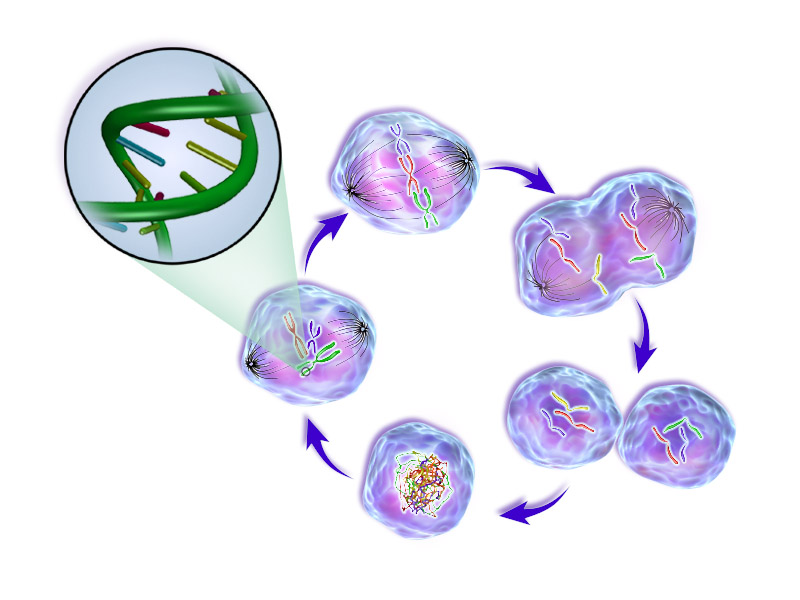
Cell cycle images from wikimedia under CC BY-SA 4.0.